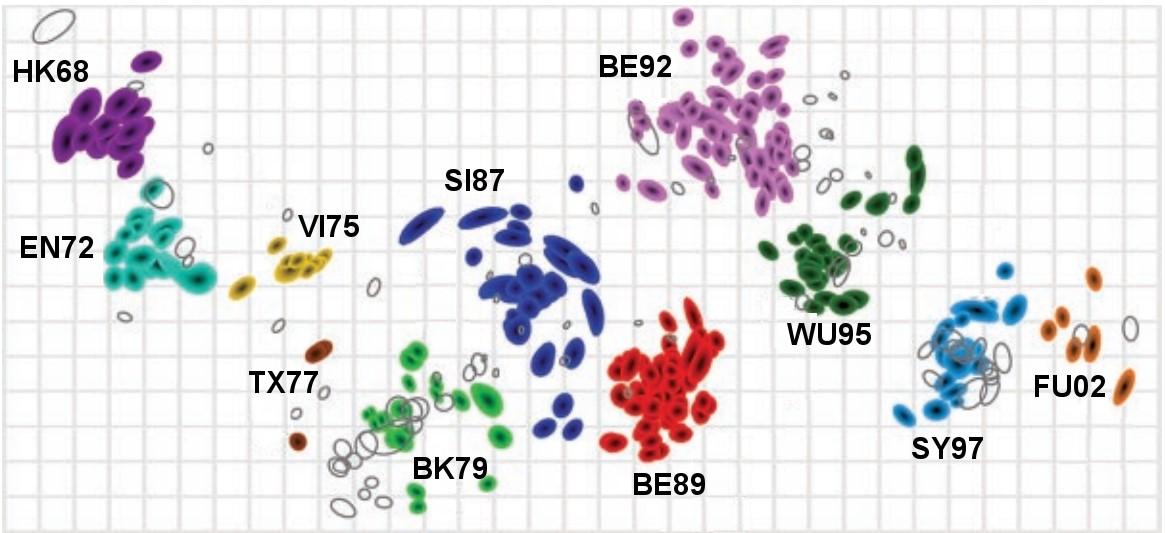
Antigenic Cartography is the process of creating maps of antigenically variable pathogens (more details). In some cases, as in the image above, two-dimensional maps can be produced which reveal interesting information about the antigenic evolution of a pathogen.
This is the first antigenic map of the influenza A(H3N2) virus from 1968 to 2003. Each strain is coloured to represent the antigenic cluster to which that strain belongs, while the antisera used in the HI assays are shown as non-coloured open shapes. Clusters are named with two letters referring to the location of the first isolation and two digits refer to year of isolation. Both the vertical and horizontal axes represent antigenic distance; this is similar to the way both axes on a geographical map represent geographic distance.
We use antigenic cartography, along with genetic and population biology techniques, to study basic questions in pathogen evolution, and coevolution with the acquired immunity in host populations.
Antigenic cartography is a new mathematical and computational method which for the first time allows one to quantify and visualize fine-grain phenotypic differences among strains of viruses or bacteria (Smith et al., Science 305, 371-376, 2004).
Antigenic cartography has been developed using data on human influenza virus subtype A(H3N2), and is routinely used to analyze the global data from the World Health Organization influenza surveillance network as part of the influenza vaccine strain selection process.
Antigenic maps differ from genetic analyses in that they are based on data that reflect the antigenic properties of a pathogen (in this case as revealed by haemagglutination inhibition assay data).
There is a close relationship between genetic and antigenic change for human influenza A(H3N2) virus, but genetic distance can be an unreliable predictor of antigenic distance. For example, a change in a single amino acid may cause a disproportionately large change in the binding properties of a virus strain.
Antigenic maps can reveal large movements in the antigenic space that may be due to minimal amino acid changes. Antigenic cartography therefore offers the possibility of improved understanding of genetic and antigenic evolution.
